This week I had the pleasure of attending Edward Tufte’s one-day course, “Presenting Data and Information” in Miami.
I’ve followed Tufte’s work for years. This was the first time I was able to make it to one of his courses, so I jumped at the chance.
There were at least 200 people in my session. I was expecting a smaller turnout, but I was not surprised. There is a lot of interest in Tufte’s work. I happened to sit next to Matt Lavoie who had likewise driven down from Orlando just to attend the course.
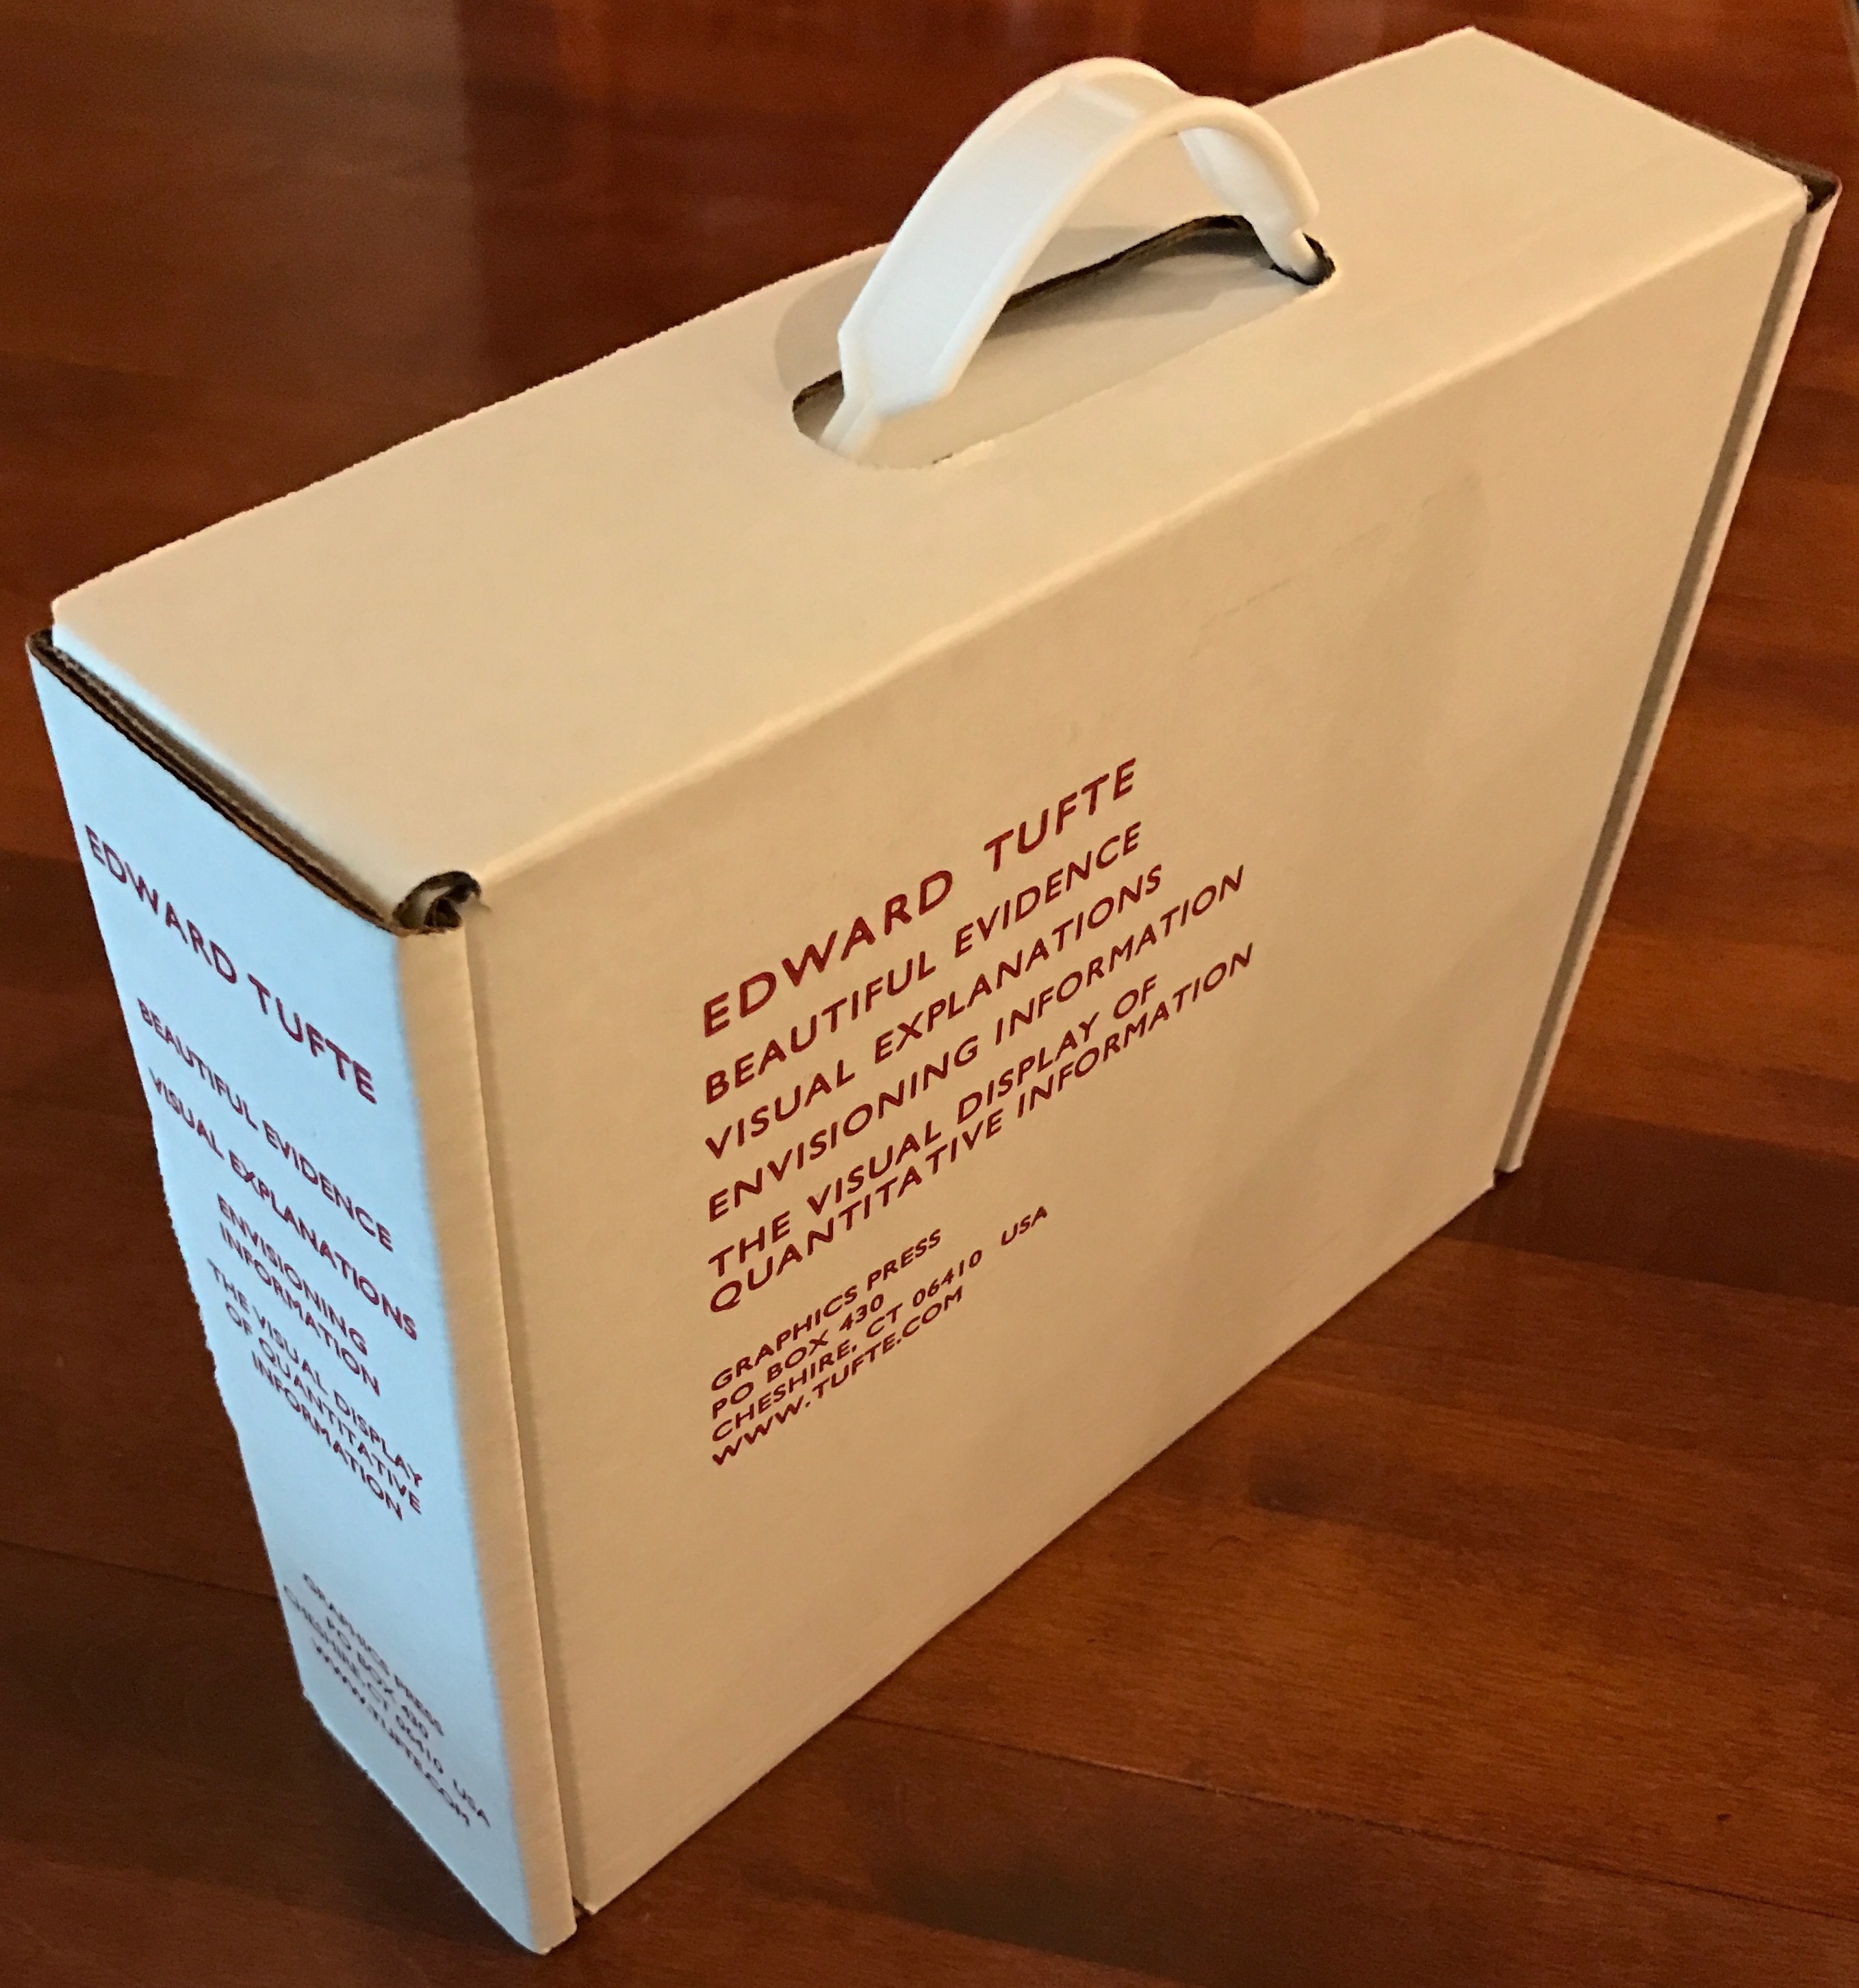
The fee for the course included copies of four of Tufte’s books: “Visual Explanations”, “Envisioning Information”, “The Visual Display of Quantitative Information”, and “Beautiful Evidence”. We were given an hour of “study hall” to read specified passages in these books before the lecture.
Tufte did an excellent job of presenting. He is a seasoned lecturer and he makes it a pleasure to learn from him. Indeed, a bit of the “study hall” reading described a presentation as a performance and explained the benefits of treating it as such. He took complete control of the environment, unobtrusively having his assistants raise and lower the lights as appropriate, for example, when he wanted us to look at the big screens versus when he wanted us to read long in a book. He used video and music in addition to static displays in ways that were useful, not gimmicky.
One thing surprised me early in the reading. It is stated on page 50 of “Envisioning Information” that the bandwidth of the optic nerve is approximately 10Mbps. There is a reference to “How Much the Eye Tells the Brain” (Koch et al., 2015). I had long ago read a statement by John Carmack that the optic nerve only carries around 57kbps, which was the top speed of dial-up Internet access (57.6kbps) at the time. The interesting point I took away from Carmack’s statement is that once we have a way to inject data directly into the optic nerve, all of the advances in pixel pushing of the last few decades will be obsolete. There will be no need to push enormous amounts of data into the eyes as pixels only to have the retinas filter this down to a very narrow stream of information. Nevertheless, once I got over the initial shock of the fact I’ve been carrying around for years being wrong, the difference between 10Mbps and the bandwidth consumed by modern screens (a DisplayPort 1.3 cable carrying 5K content is pushing 26Gbps) is so huge that the point still stands.
I was a little disappointed to have some of the time spent on topics I had already read about from Tufte including admonitions against using PowerPoint, the utility of sparklines, and the beauty of Minard’s diagram of Napoleon’s March. That said, I benefited from another lecture about Minard’s diagram and I don’t know how he would have tailored his course to accommodate the things that the audience has already learned from him outside of the course.
There were a few little nuggets that I thought especially noteworthy:
- He made a good point about using scrolling navigation to reveal more detail. This has become de rigueur in online publications such as news sites. It seems a lot more effective at allowing people to dive only as deep as they want to in an article or data set. It’s something to think about when building user interfaces to data.
- He made a point about how cartography is a great example of design “deweaponized” (that wasn’t his wording, it’s how I interpreted it) from the needs of advertising. Many discussions about design are in the service of advertising, which is inherently attempting manipulate the reader. Cartography uses great design to maximize the information presented to the reader without attempting to manipulate (other than obvious examples where maps combine political areas and may attempt to contrast them). He pointed out the details in some maps and how they serve the user.
- One point made about the rise of multitouch screens is that they allowed user interface designers to reclaim screen real estate that had previously been consumed by scroll bars. I had never thought about that.
- He had a good example of using video for data analysis. He had a very sophisticated shot of a soccer goal that showed the locations at various points in time of the key players and the ball. It used varying opacity to reflect locations in time. This seems a great way to add a time dimension to visual content.
If you are doing anything with representing data, I consider it well worth the money and time and highly recommend it.